A Metric tells CoachAccountable what you're tracking, the duration you'll be tracking, and, if fitting, the target you want to hit.
Setting up a Metric - Basic setup
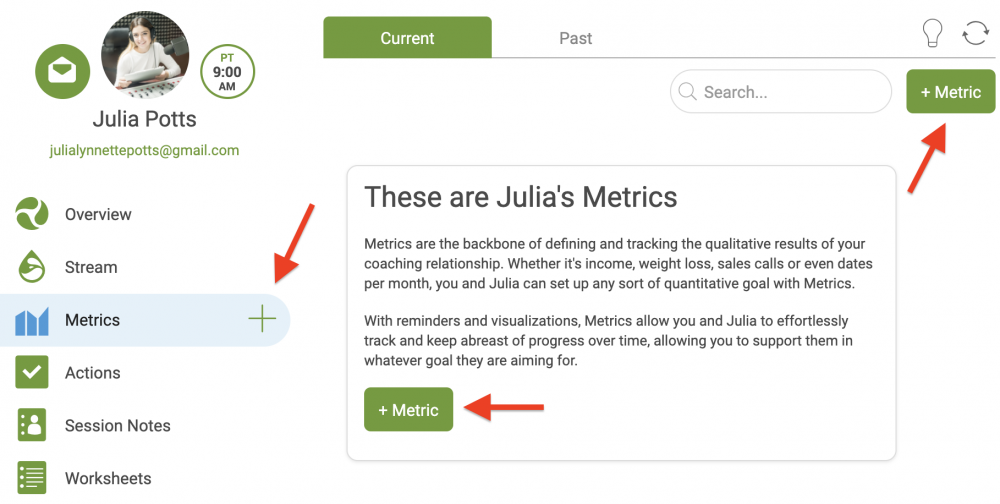
Choose the client you want to create a Metric for, then click the Metrics tab from the Left Sidebar. To begin a new Metric, click the + next to Metrics or the +Metric button.
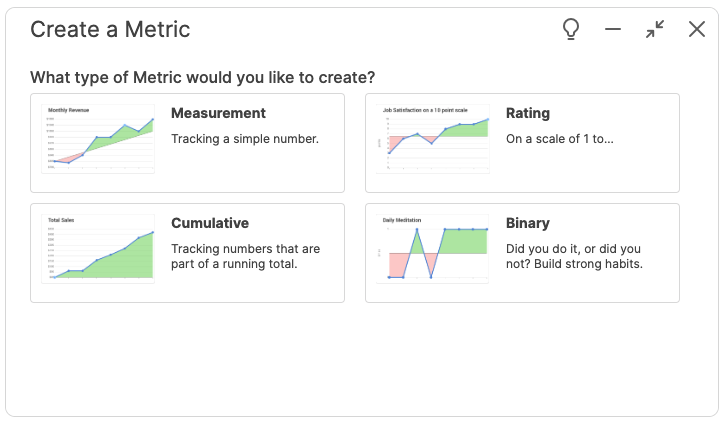
The Create a Metric window will appear. Choose which type of Metric you'd like to create:
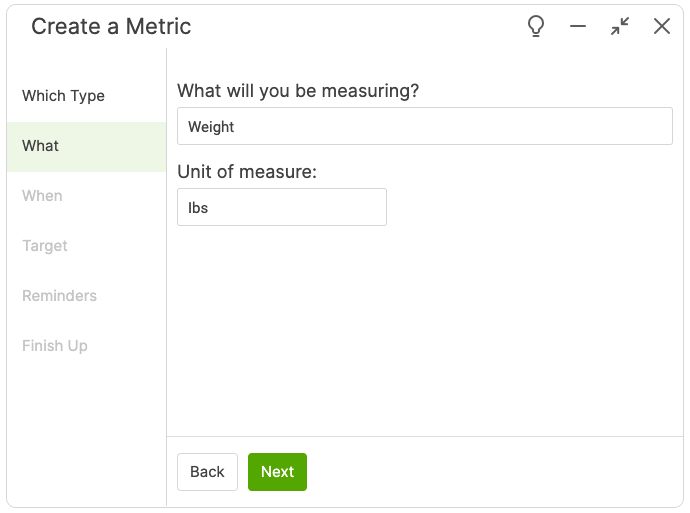
Let's go through creating a new metric using a typical Measurement Metric as an example. Now, go through the prompts:
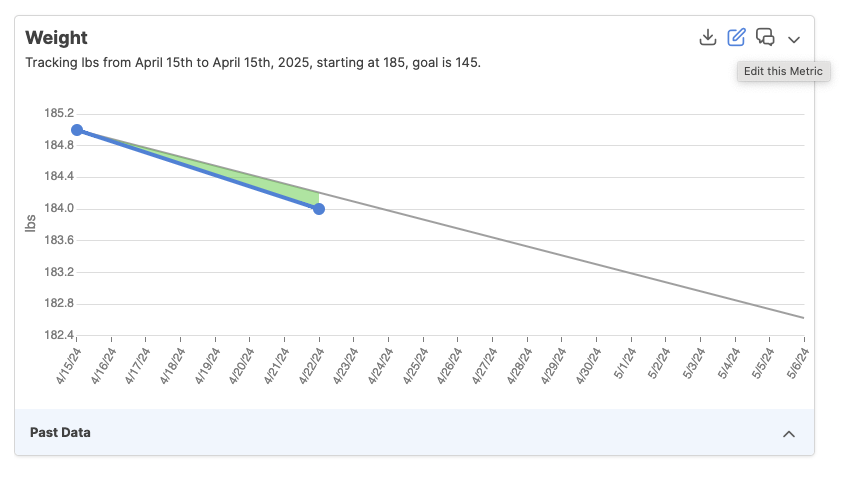
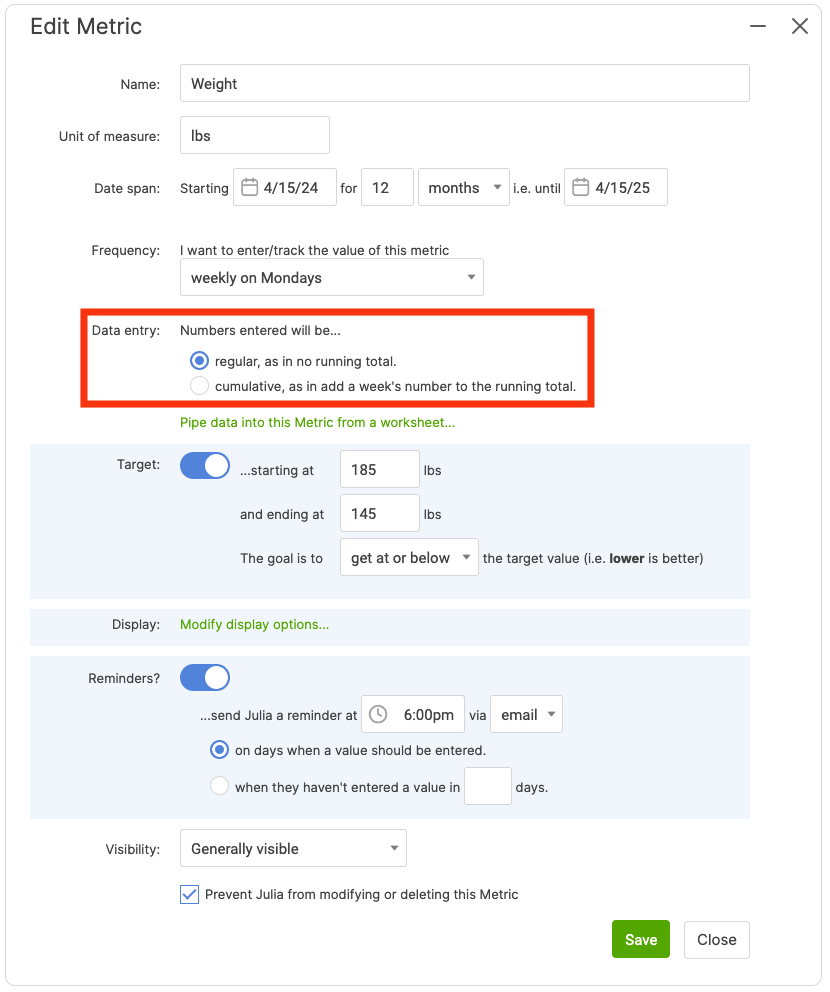
What: Here, you define whatever you want to track over time. In this example, we're using Weight.
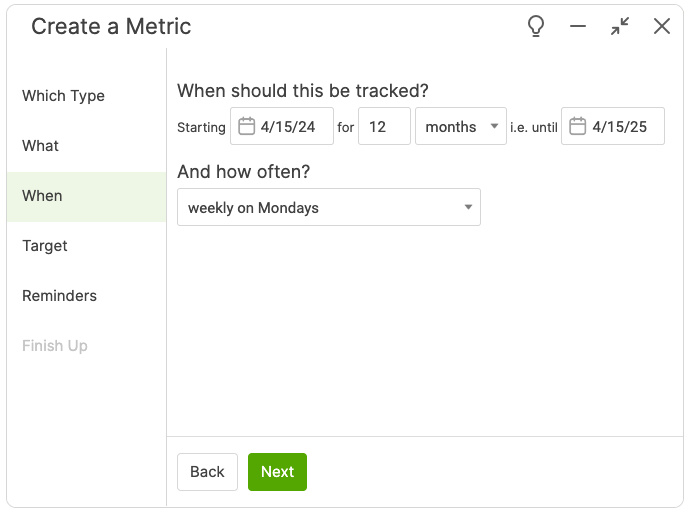
When: Set the duration and how often data should be recorded. After selecting a start date, you can either set a duration or choose an end date. In this example, we are doing a duration of 12 months (which sets the end date automatically).
Frequencies that start on a day of the week, such as "weekly on Mondays," are determined by your start date. To change this, adjust the start date.
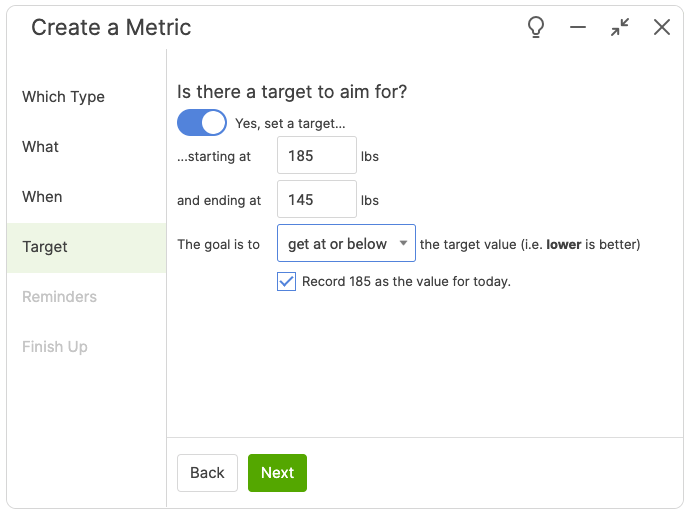
Target: If fitting to do so, you can set a Target range for the Metric, and if getting higher or lower than the target values set is better. CoachAccountable computes a target trend line based on these numbers, providing a way to see if performance is on track to hit the end goal.
 Reminders: Reminders are key to consistent tracking and performance. You can send these via email or text (if available). You'll also pay attention to whether you want these sent on days a value should be entered or if a value hasn't been entered after a certain amount of time.
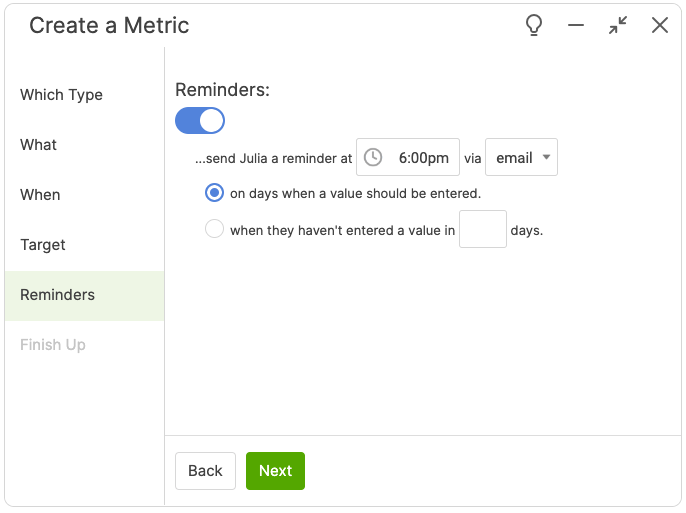
Finish Up: Here, you'll set visibility and determine if you allow the client to modify or delete the Metric. You can set up having data piped in from a Worksheet.
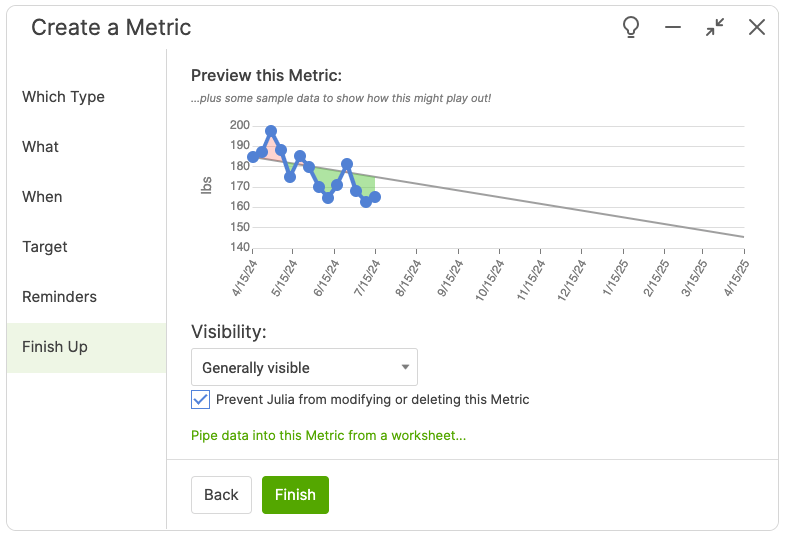
Now, click Finish and you're off to the races!
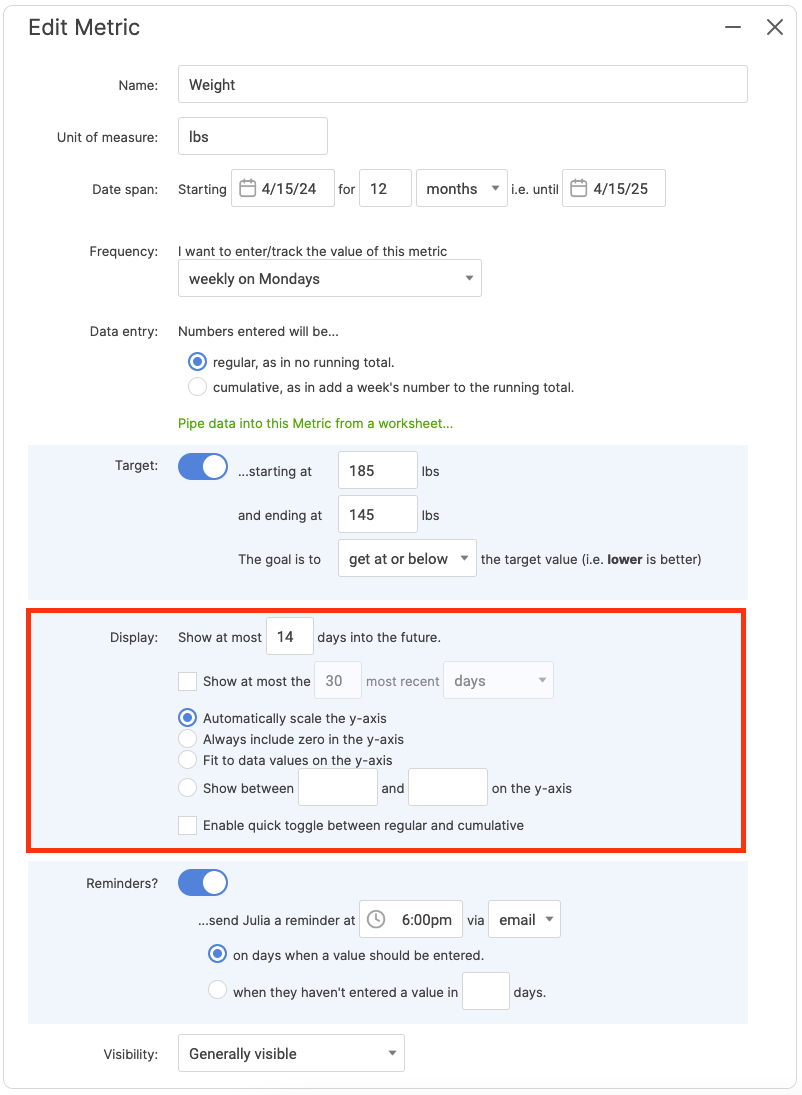
You can modify your Metric anytime to change the basic setup you did through the prompts.
You'll adjust Data Entry to be either Regular (no running total) or Cumulative (keep a running total) here, as well. Regular is an all-purpose method for data entry, while cumulative works well for sales and other measurable productivity.
You can also modify how the graph looks in Display.