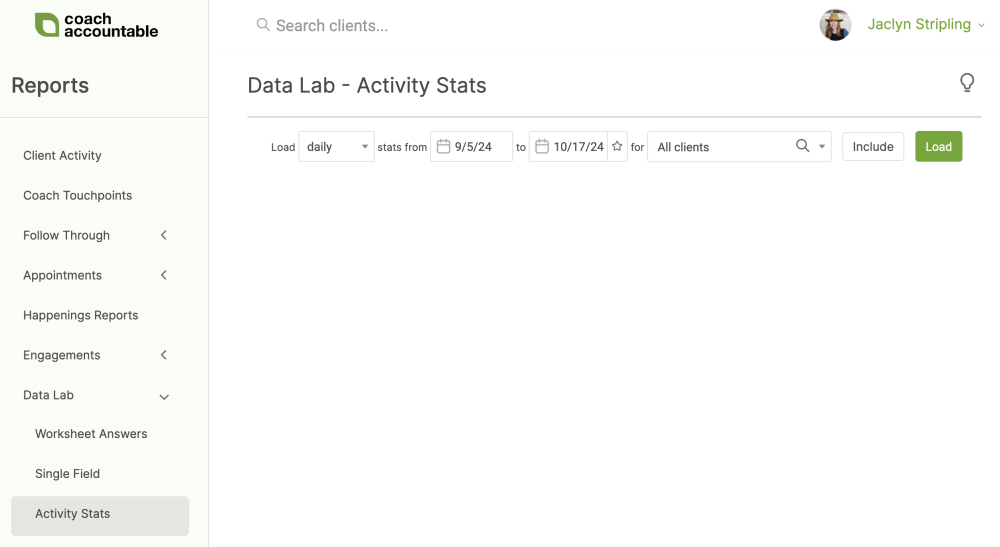
The Activity Stats report provides a birds-eye view of the activity over your entire account. Find it in Reports >> Data Lab >> Activity Stats.

Selections
You can choose the buckets you'd like to see: daily, weekly, monthly, quarterly, or yearly. This choice determines what your columns reflect.
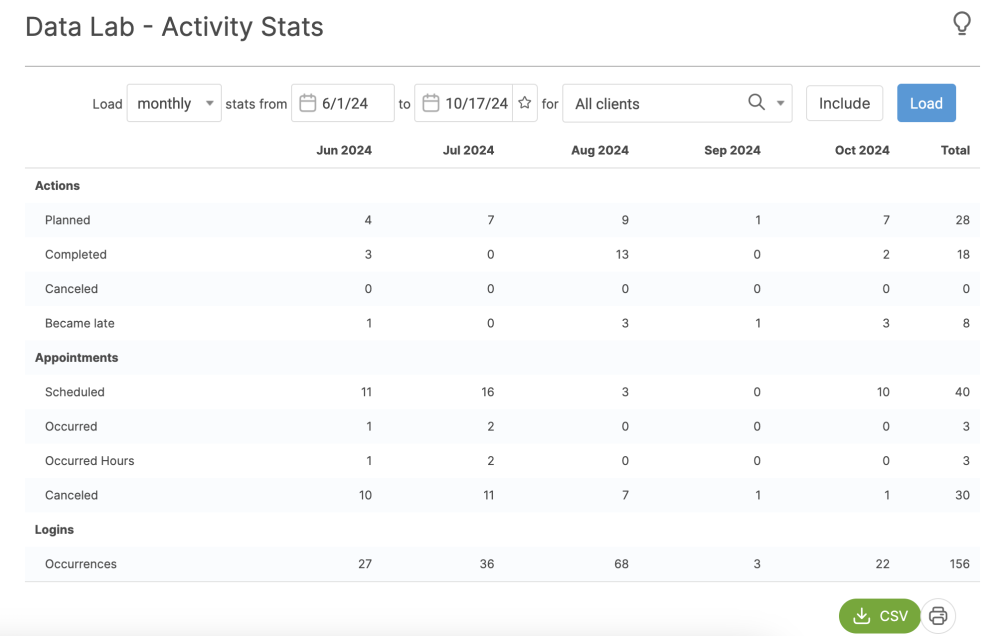
Next, choose the date range you'd like to see data for. In the example below, we've set the time span for the report to be all of 2019, viewed by quarterly activity.
Choose whose numbers you'd like to see. You can view activity statistics for all clients, one specific client, a Group, or a Company. For Team Edition accounts, you can also view the activity of all the clients under one of your coaches.
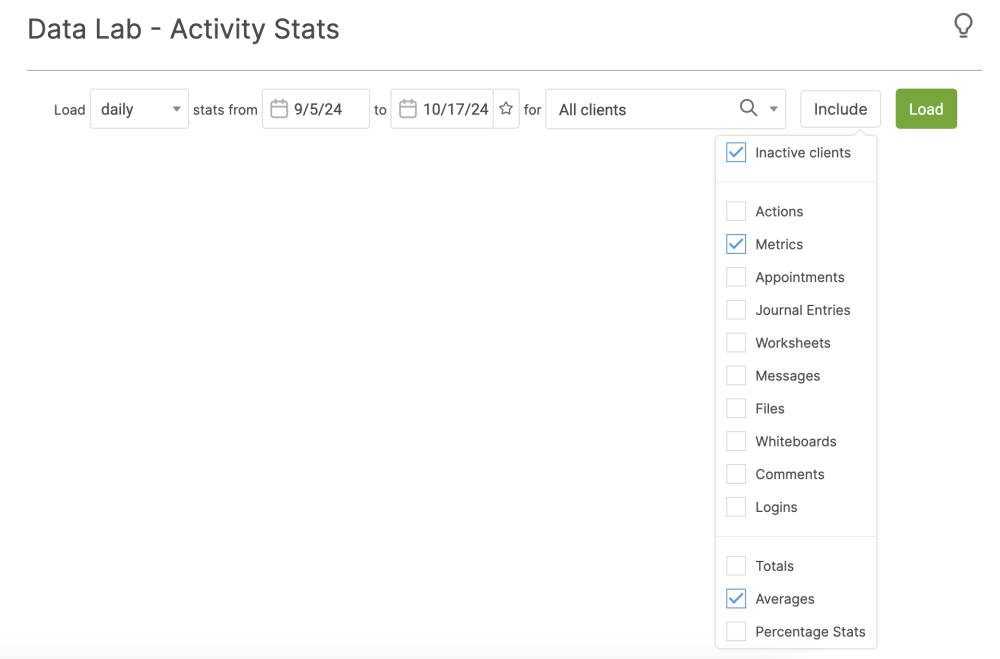
Finally, choose what should be included in the report. In particular, totals, averages, and percentage stats can give you some interesting insight into what's happening across your entire account.

Note that you can then download this report as a CSV for further calculation or sharing.
