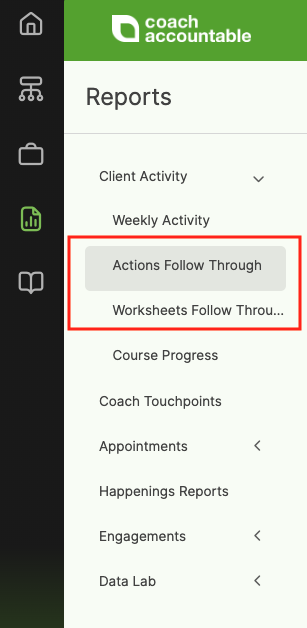
There are two flavors to choose from when it comes to viewing the timeliness and completion of client assignments: Actions and Worksheets.
Here’s an example of a Follow Through Report on Worksheets that have been assigned over the last month or so:
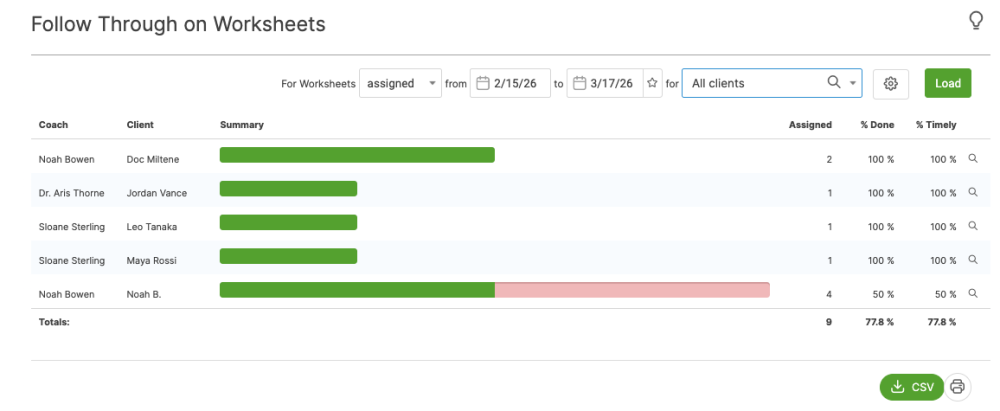
The total width of the summary bar is proportional to the number of assignments a given client has had over the date range in question. Hovering your mouse over a given colored summary band explains what contributes to it. Clicking on any header allows you to sort, and even the summary column is sortable, revealing a rough ordering of the overall consistency of follow through.
If you are using Team-Edition, sorting by summary, then by coach gives a nice summary that is grouped by coach. Solid bands in the summary bar are for items that are completed; the faded variations denote not yet.
Report Customization and Filtering
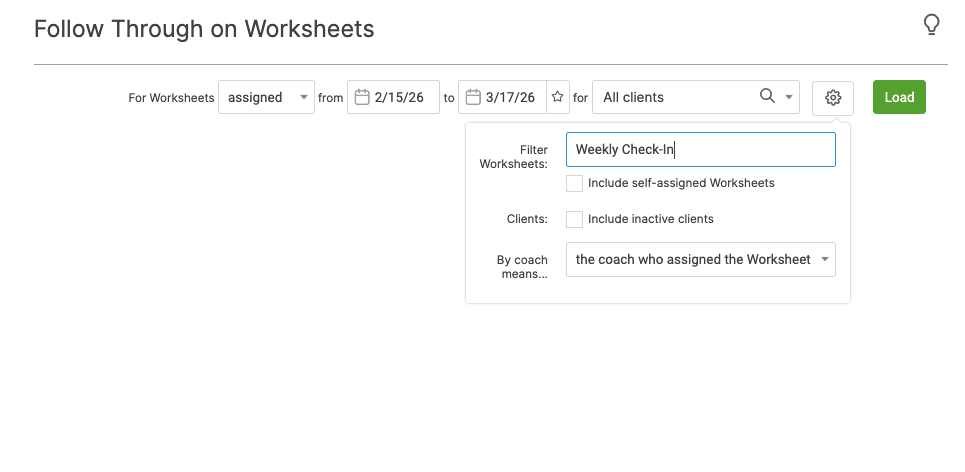
By clicking the gear icon, you reveal a few more controls by which to customize and filter your report. If, for example, you have all of your clients doing a weekly reporting, you can get an at-a-glance view of who is and who isn’t keeping up for a given week (or over any other time span), like so:
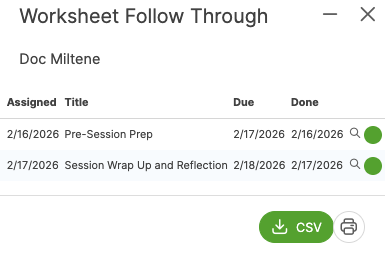
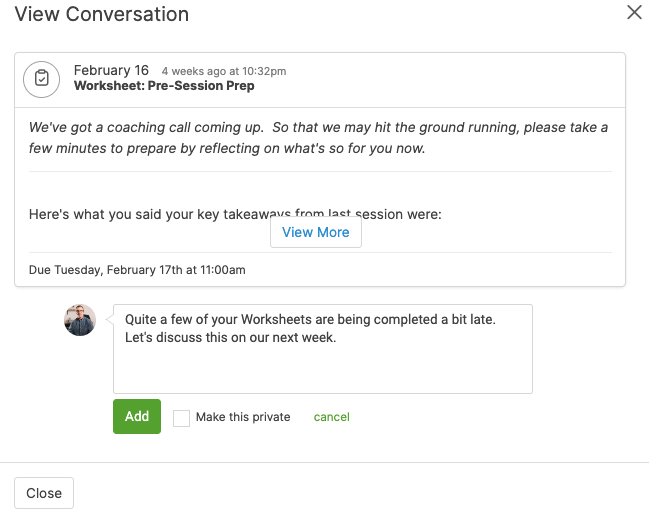
Drilling Down